Everyone is Now a Business Analyst — and Tableau Can Help
Author: Darya Drobova
A Short Case Study
Data now drives every role, in every function, in every organization.
There are a few reasons for this:
- Data is now being collected for nearly every user interaction in the enterprise
- Self-service Business Intelligence (BI) tools and cloud services have made this data affordable and easy-to-use for everyone
- Modern BI tools deliver real value — they help employees analyze reports and tables faster and more effectively, and they combine with modern storytelling tools to rapidly distribute data-driven insights across the organization
In short: enterprise-wide BI has transformed from a “nice to have” to a “need to have” for every organization, and leaders are looking for new ways to increase the scope and impact of their BI systems.
Tableau offers one way to do just that. It’s the market-leading BI platform for a reason. It gives users a broad, deep, intuitive, and truly end-to-end solution, and we deploy it often for our clients. We have found Tableau to be very flexible and capable of fitting into a wide range of enterprise architectures. Most important, our clients have found Tableau easy-to-use — even by the many non-technical users who now work with data.
For the rest of this piece, we’ll walk you through a case study where we used Tableau to solve a tricky BI problem that one of our clients couldn’t solve on their own.
The Client: Leading Multinational Software Provider
Our client was an industry leader who wanted to offer even more value to their customers. They were a large multinational software developer that serves the pharmaceutical space. They provide a platform that drives clinical trial workflows, and revolutionizes site-to-sponsor connectivity through a virtual site workspace.
Their customers use their platform for a wide range of virtual tasks, including site inspection readiness oversight, remote monitoring, study startup, and quality control.
When this client contacted us, their platform was already one of the best-reviewed, and highest-ranked platforms in their industry. Yet, this client wanted to make their platform even better. And they knew they couldn’t do it alone.
Their BI Challenge: Uniting Two Databases Into One Dashboard
Our client wanted to give their BI platform a flexible and interactive dashboard, and to later embed this dashboard into their website. But when they contacted us, their platform had a data sync problem that prevented this functionality.
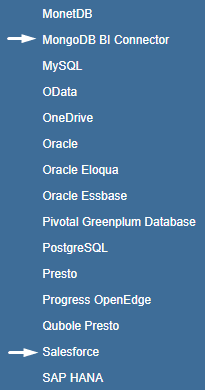
You see, their platform stored data in two unrelated databases — Salesforce and MongoDB. Our client couldn’t find a way to synchronize these two databases. The platform’s users were forced to enter their data in both places, and our client struggled to build a dashboard that displayed data from both at the same time.
To solve this problem, our client needed to build a solution to:
- Connect the listed databases in real-time
- Link data from them and create visualizations of that data
- Build a flexible, interactive, and easy-to-understand dashboard with filters and other dynamic elements
Unfortunately, they couldn’t build this solution on their own. Their internal BI development team lacked the ability needed to link the two databases and create this dashboard. They didn’t have the time to train their staff to build this solution — they needed it quickly. That’s when they reached out to IBA.
Our Solution: Developing a Custom Tableau Deployment
Our team of BI specialists immediately knew the solution — Tableau.
Tableau is very flexible, and capable of connecting numerous databases, including Salesforce and MongoDB. Tableau is able as well to create a flexible, interactive, and easy-to-maintain dashboard using both databases’ data.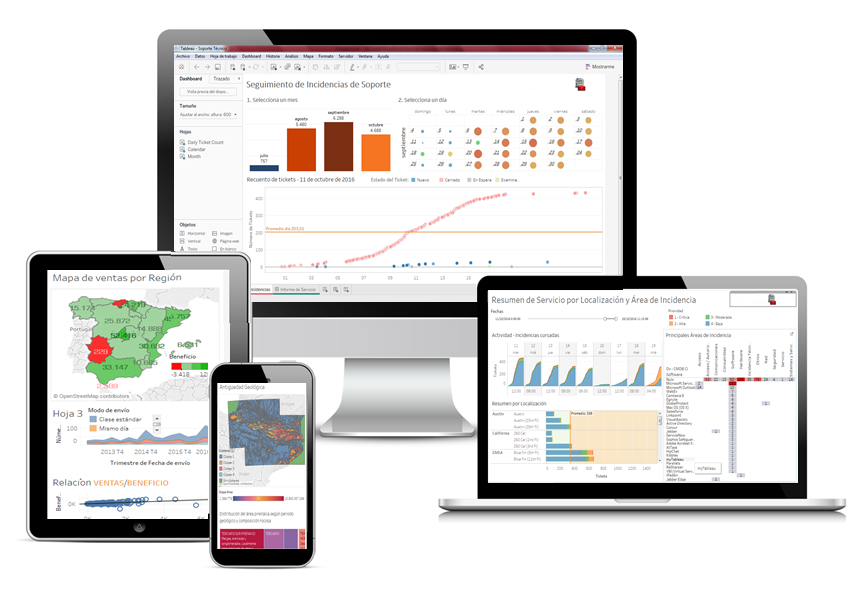
To develop our client’s custom Tableau deployment, we followed a few steps and overcame a few challenges:
- Working Around Access and Permissions. Our client had routine policies around data sharing they had to work through, so we waited to gain access to their Salesforce and MongoDB databases. However, we didn’t wait to start work. Instead, our BI developers used their own personal licenses and local access — as well as test data from the client — to begin to better understand the project, and to define what the solution would need to look like.
- Connecting Salesforce and MongoDB. This was easy. Tableau had recently been acquired by Salesforce, so they integrated seamlessly. It took a little longer to integrate MongoDB, and to connect the two, but overall we quickly connected all of our client’s databases and data.
- Designing the Tableau Dashboard. Our client’s designers prepared a dashboard template. We developed the working dashboard according to this design. Our client did make a few design tweaks during the last stage of development — in response to user tests — that we quickly implemented.
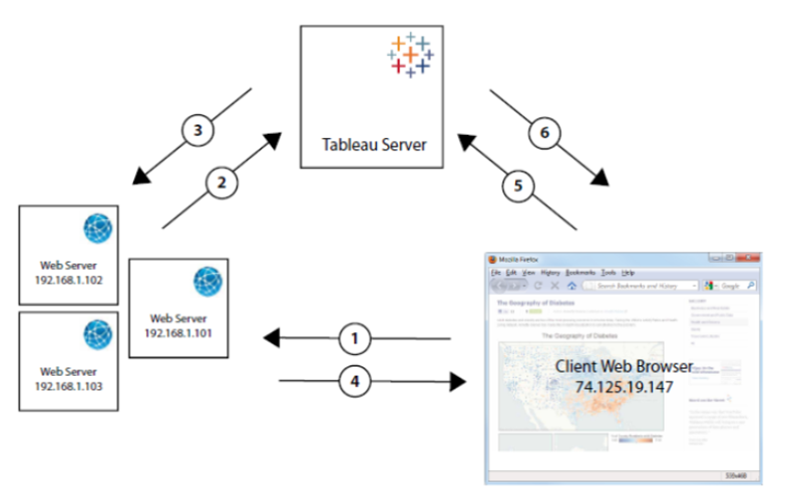
Integrating Tableau and their Website. Finally, we had to embed their dashboard into their website, and users only needed to sign in once to view data from both databases. To do so, we created an authentication and site-specific Single Sign On (SSO) process by setting up a trusted relationship between our client’s Tableau server and web server(s).
In addition, we worked with our client to resolve two more project details:
- Licensing. They had been using a role-based license model for Tableau, which limited the number of people who could access the platform. We switched them to a core-based license model that let users access the platform via guest accounts, and let their servers support a nearly unlimited number of users.
Data Security: We created security settings — via filters associated with user email addresses — to ensure each user could only see the data that they were permitted to see (e.g. their company’s data, their product’s data, etc.)
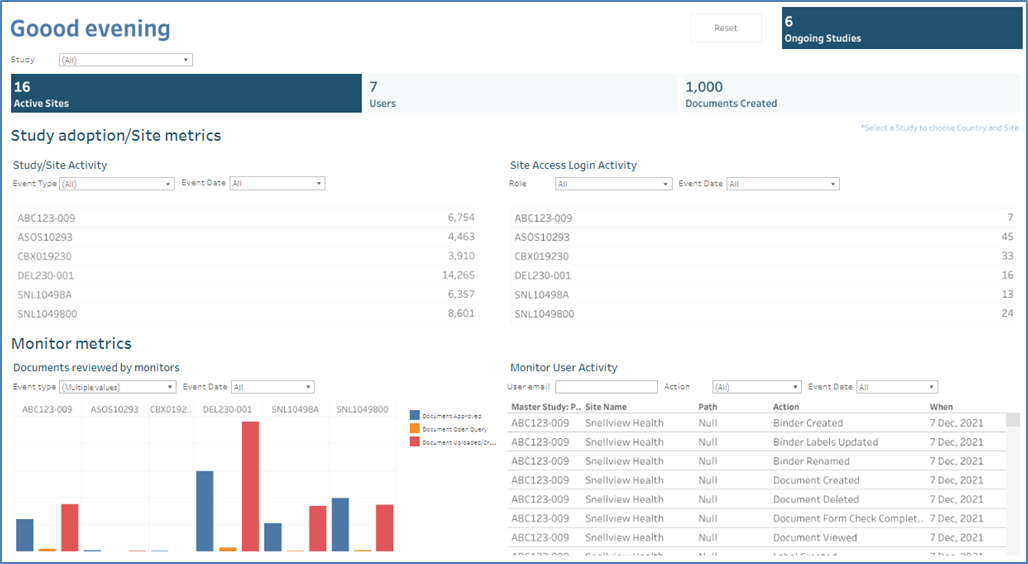
Dashboard, initial version
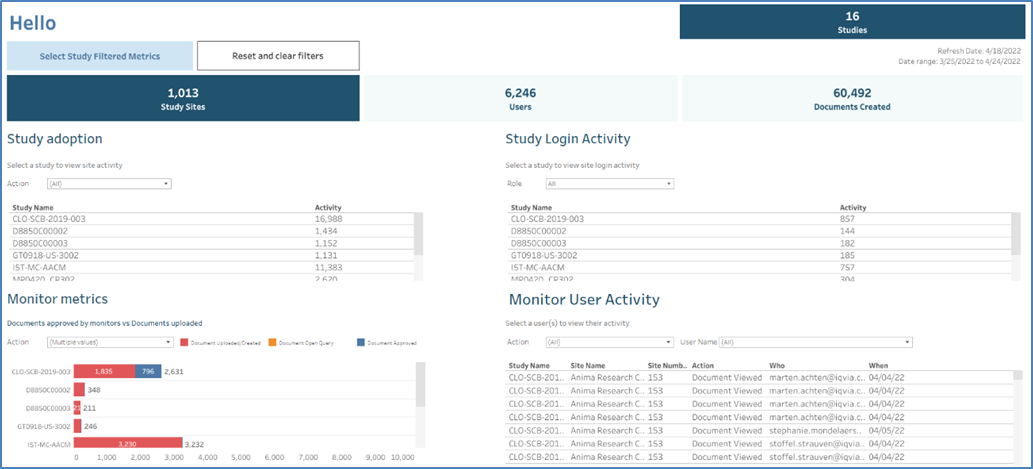
Dashboard, final version
As you can see, we added some signatures, made an update in the design of the buttons, turned the diagram in the lower left corner upside down. In general, the changes are small, but the picture has changed. After the testing phase, users found some weaknesses in the Dashboard and asked for some changes to better understand some data. And despite the fact that this version seems to have become final, most likely additional adjustments will be made in the process of work to improve.
Their Results: Seamless Integration Into a Single Source of Truth
Ultimately, we created the solution our client needed, within the timeframe they required. Our solution:
- Synchronized data between Salesforce and MongoDB
- Gave users one convenient home for all information in all of their databases
- Let users interact with their information via graphs, tables, and filters to drill down into their data, and deeply and rapidly analyze every possible scenario
- Operates without interruptions, and is supported by our client’s internal development team (after some training and documentation from us)
In sum: Our client was happy, their users were happy, and we closed out the project confident that we hit every target we set out to achieve.
Bring Better BI to Your Organization
These results were not a fluke. At IBA we’ve helped many organizations implement BI tools like Tableau. We employ a full team of talented BI developers — including certified Tableau Desktop Certified Associates – who have extensive experience deploying new tools, expanding existing solutions, and delivering better BI results.
Reach out today to see if IBA Group can improve your business analytics. Just schedule a quick chat and one of our BI specialists will help you define your needs, design the right solution, and determine if we’re the right partner for your analytics projects.